With the negative, attention grabbing headlines remaining in the media, it is easy to revert to a pessimistic and distorted view of markets and outlook for your personal investment portfolio.
One would be forgiven for believing the world was going to end, after just a few moments spent reading some of the financial news headlines. Understanding the inherent conflict of interest between media outlets and successful lifetime investors is increasingly important. In these two articles we look at the normality of temporary market declines, the questions all investors should consider and what you can do to combat those instinctively irrational thought processes.
Market volatility – strap in, it’s going to be a bumpy ride
Volatility is not just a recent phenomenon. We have been through a period of low market volatility in recent times. This has, in fact, been out of the ordinary, but it is easy to become accustomed to recent market conditions, overweight them and consider them to be the new ‘normal’. This common cognitive bias is better known as ‘recency bias’, which can have a damaging effect on wealth creation if not understood and addressed appropriately.
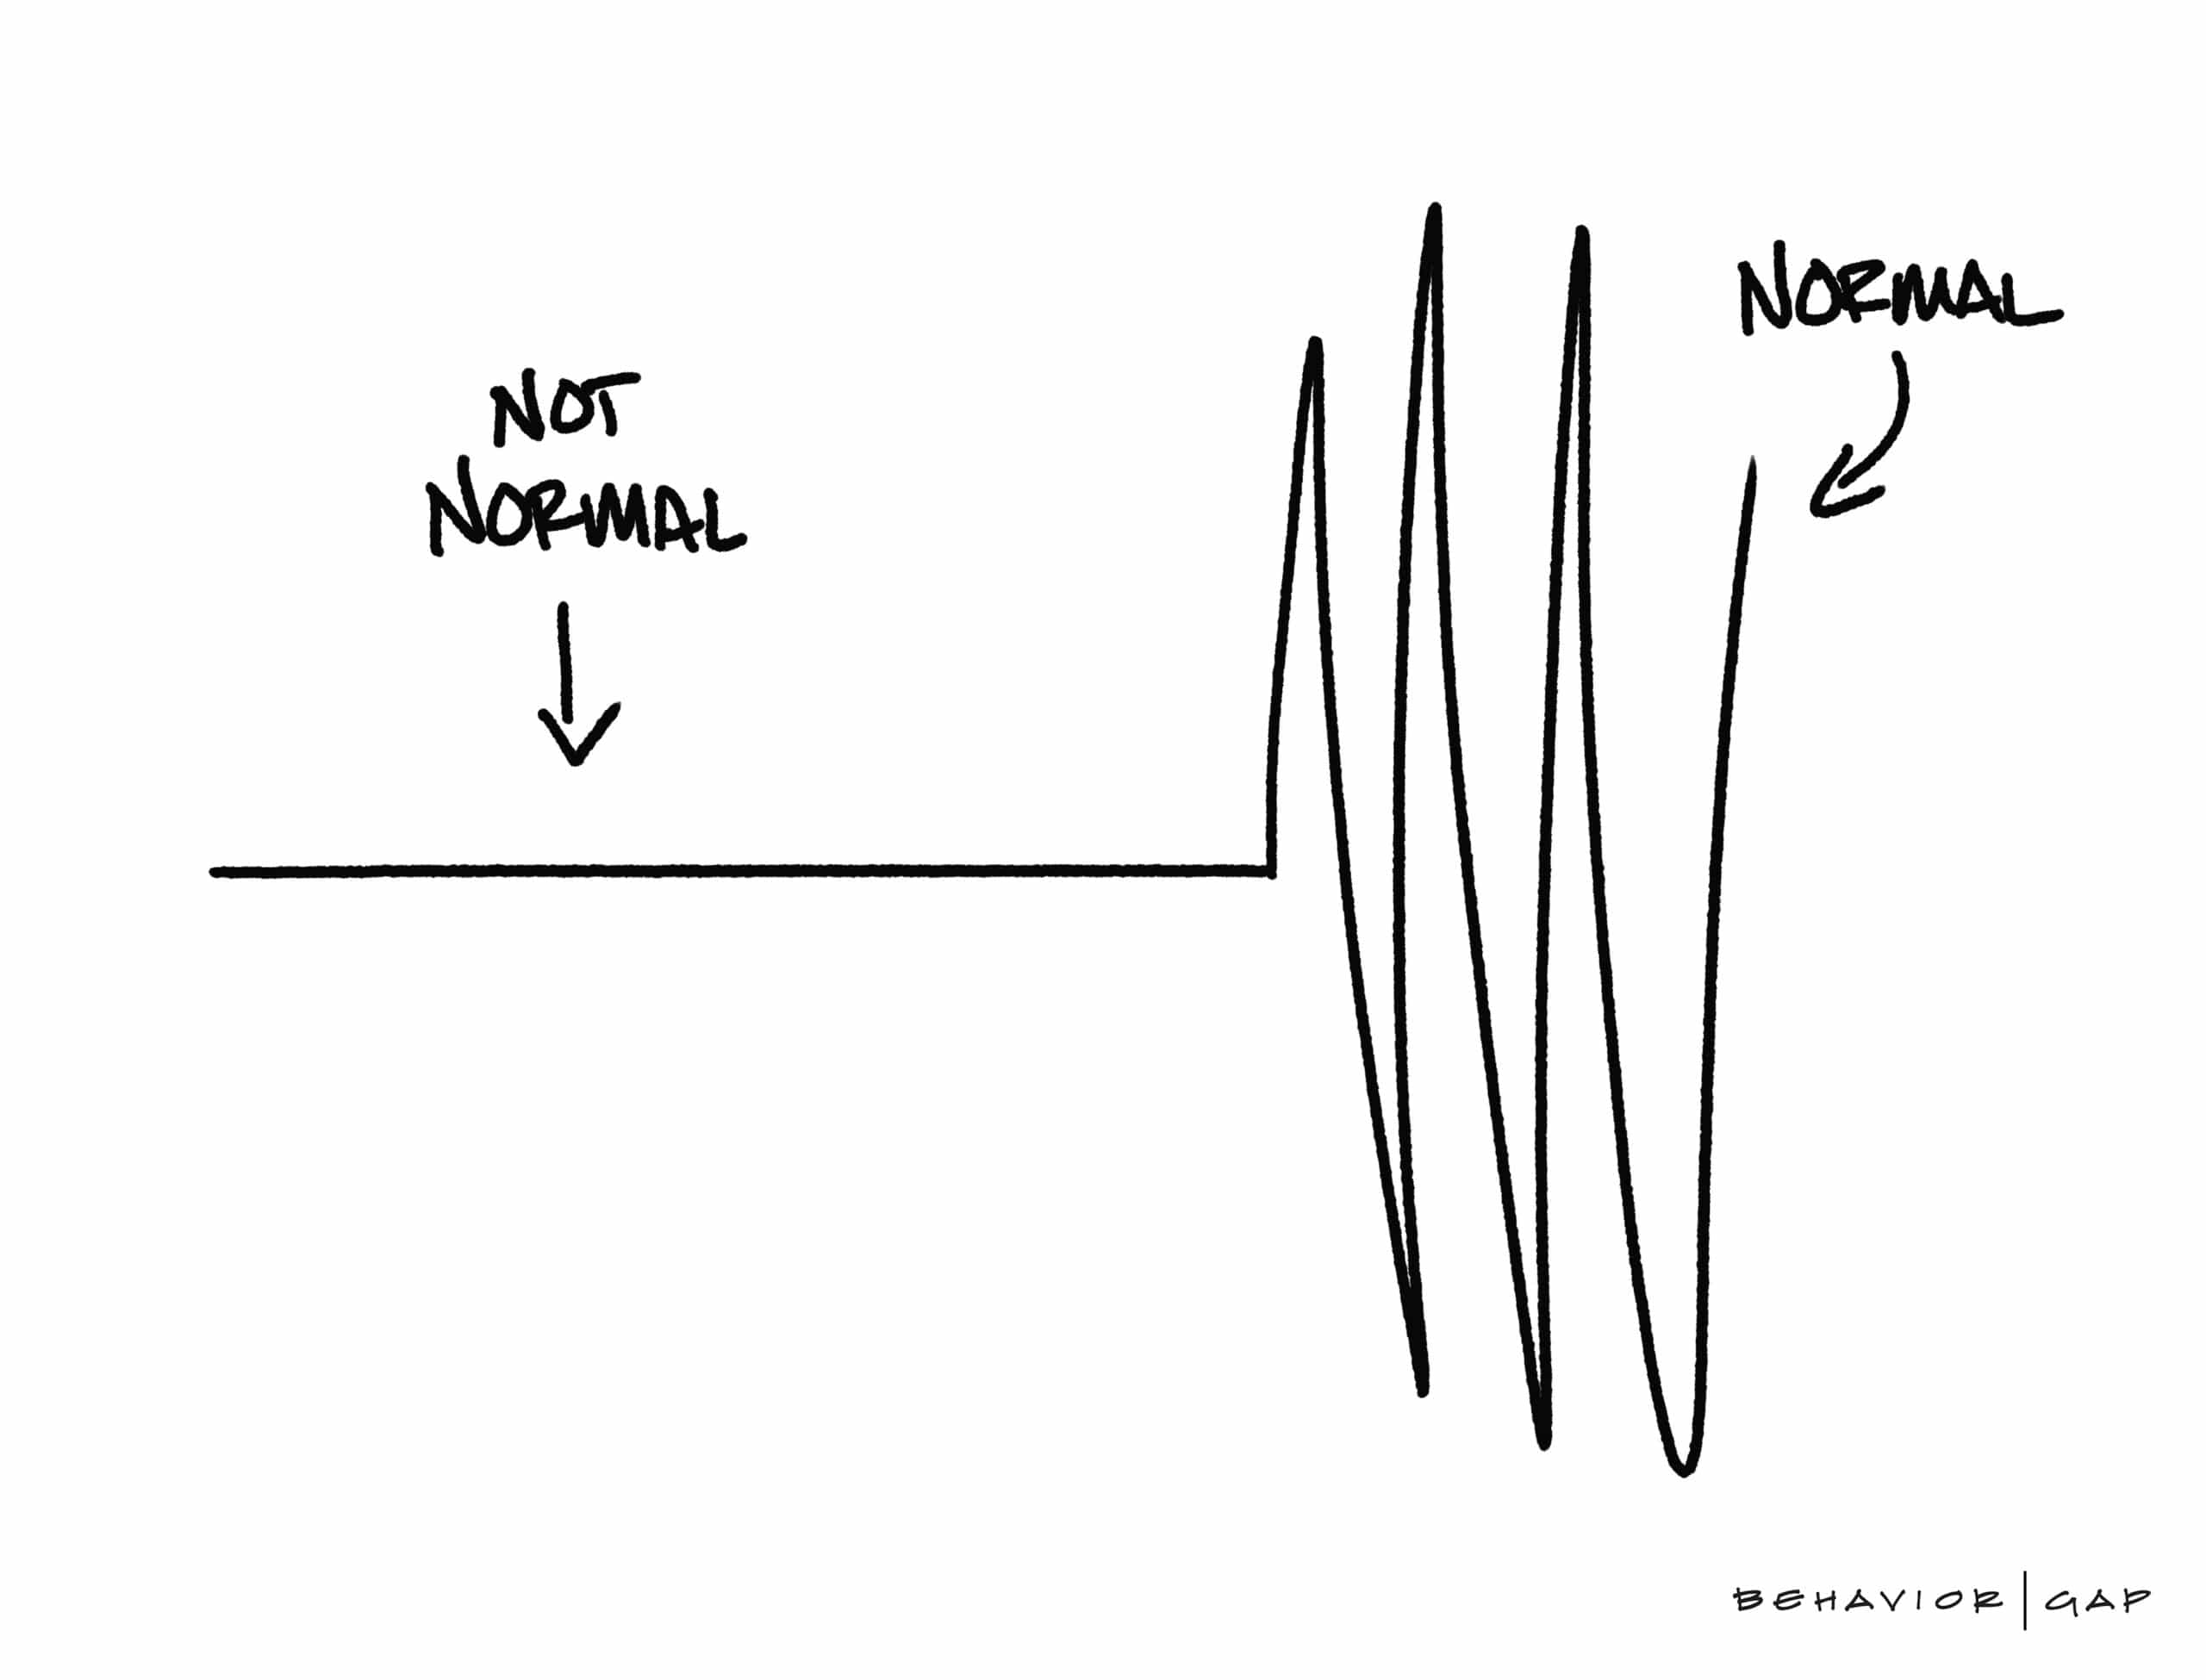
Carl Richards (Behaviour Gap, 2018)
Unfortunately, as human beings, we are hard wired to ignore our rational thought processes and focus in on – and become emotional about – adjustments to share prices. The influential investor, Benjamin Graham, was famously quoted saying ‘in the short term, the stock market is like a voting machine. In the long run, it is a weighing machine’. Understanding how capital markets function is of paramount importance, to avoid acting irrationally in times like these.
Timing the market – questions you need to ask yourself
Our instinctive reaction as investors is often to react to market news or short-term volatility. However, the academic evidence overwhelmingly suggests that trying to time the market is a sure-fire way to wealth destruction over time. Remember that your globally diversified portfolio has been proactively constructed to weather all market storms and the current market turbulence is just part of that long-term plan.
Nevertheless, investors often see short-term volatility as the enemy. This may lead many to move their money out of the market until things perceivably ‘calm down’ or the market ‘picks back up’ again. This approach may appear to solve one problem, but it actually creates quite a few more. Firstly, when do you get back in? You must make two correct decisions back-to-back; when to get out and when to get back in. By sitting on the side-lines, you may be missing a potential rebound. Not only that, you may be missing out on the potential compounded growth on that money going forward.
If you would like to speak to a qualified financial planner about this, or any other matter, please give us a call today on 01275 370670. We would love to hear from you.
The chart below illustrates this point by using a popular domestic index representing the 100 largest companies listed on the London Stock Exchange – the FTSE 100. We can see that volatility is commonplace. In fact, the average intra-year decline in the FTSE 100 between 1984 and 2017 was approximately 15%. However, the average calendar year return was 7% over the same period. (For illustrative purposes only; a 7% compounded return would represent a doubling of starting capital every 10 years.) As you can see, those investors who chose to stay in the market were rewarded for their patience with a positive calendar year more often than not and in every single period the calendar year return was higher than the respective intra-year decline.
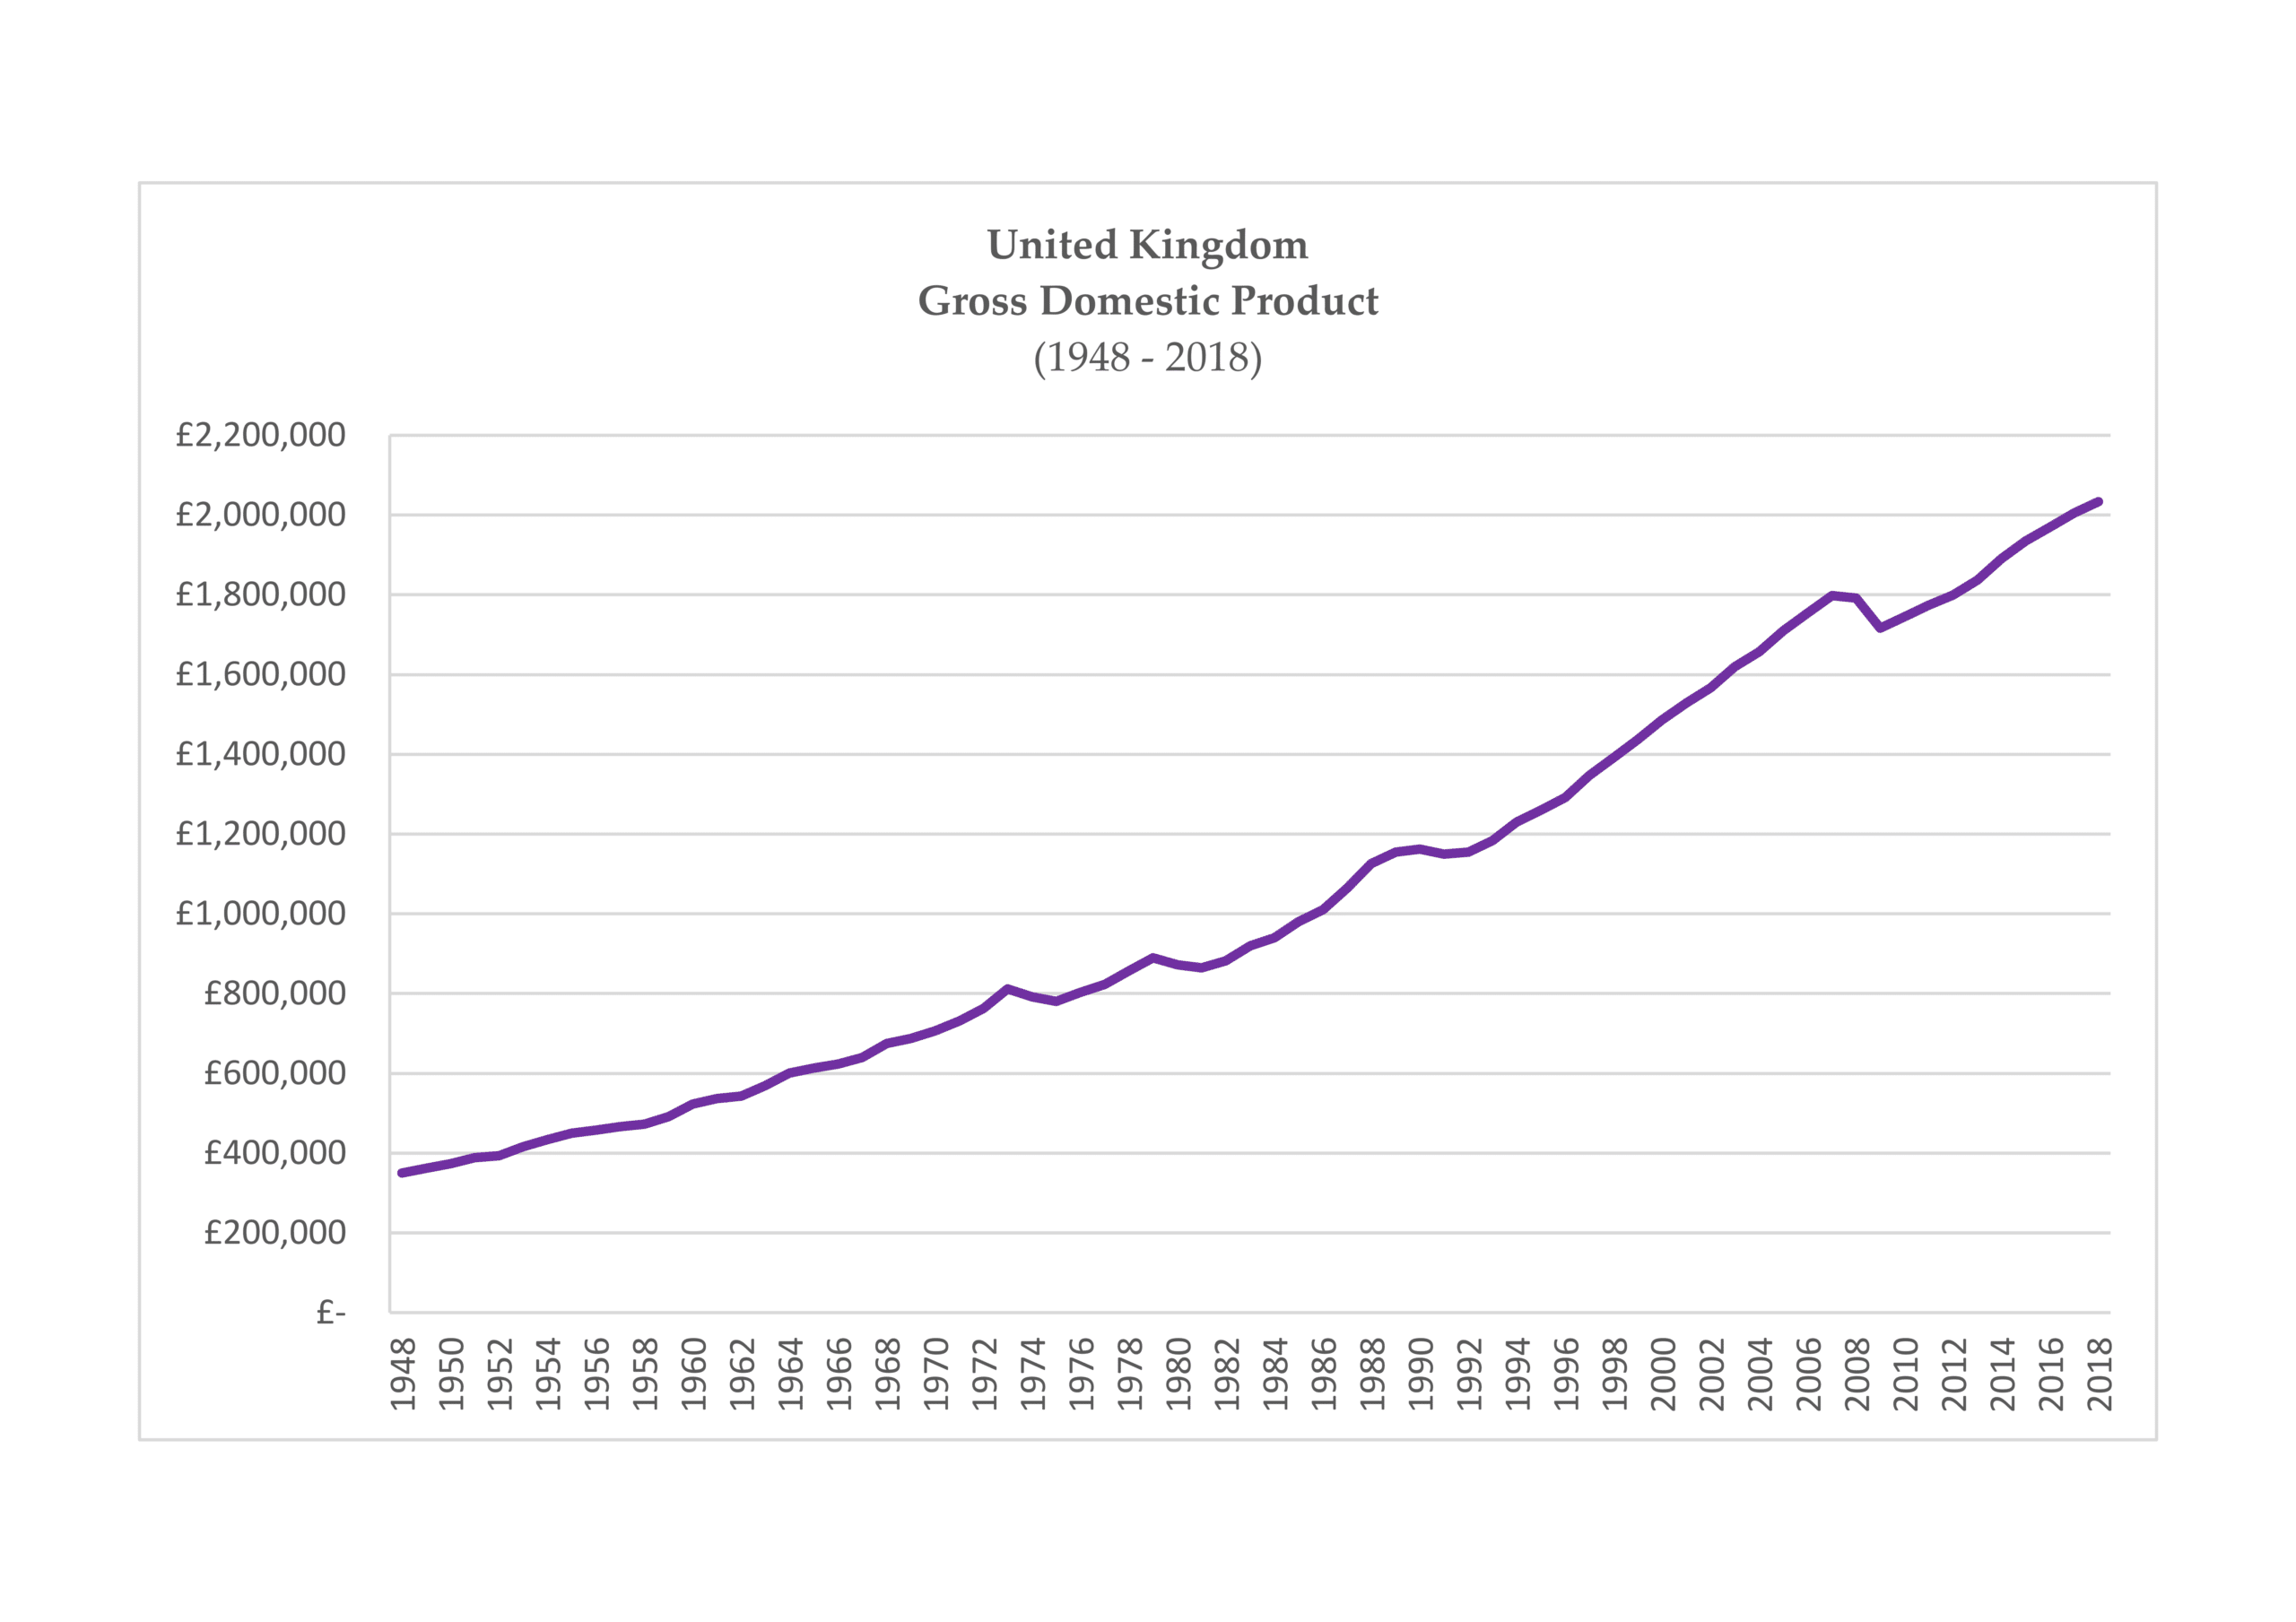
Data source: Yahoo Finance
This chart is for illustrative purposes only and not indicative of any actual investment. Past performance is no guarantee of future results.
Our follow-up article will look at the how we can keep control of our emotions during times of volatility. Click here to read more.
This article has been published for educational purposes only and should not be considered investment advice or an offer of any product for sale. Information contained herein has been obtained from sources believed to be reliable, but is not guaranteed. Past performance is not indicative of future results and no representation is made that the stated results will be replicated.